Creating with consciousness: how data and design meet desire?
How can we distill the complexity of 3D object information and design challenges into their 2D “shadows” (data) while still meeting individuals’ diverse and ever-evolving needs?
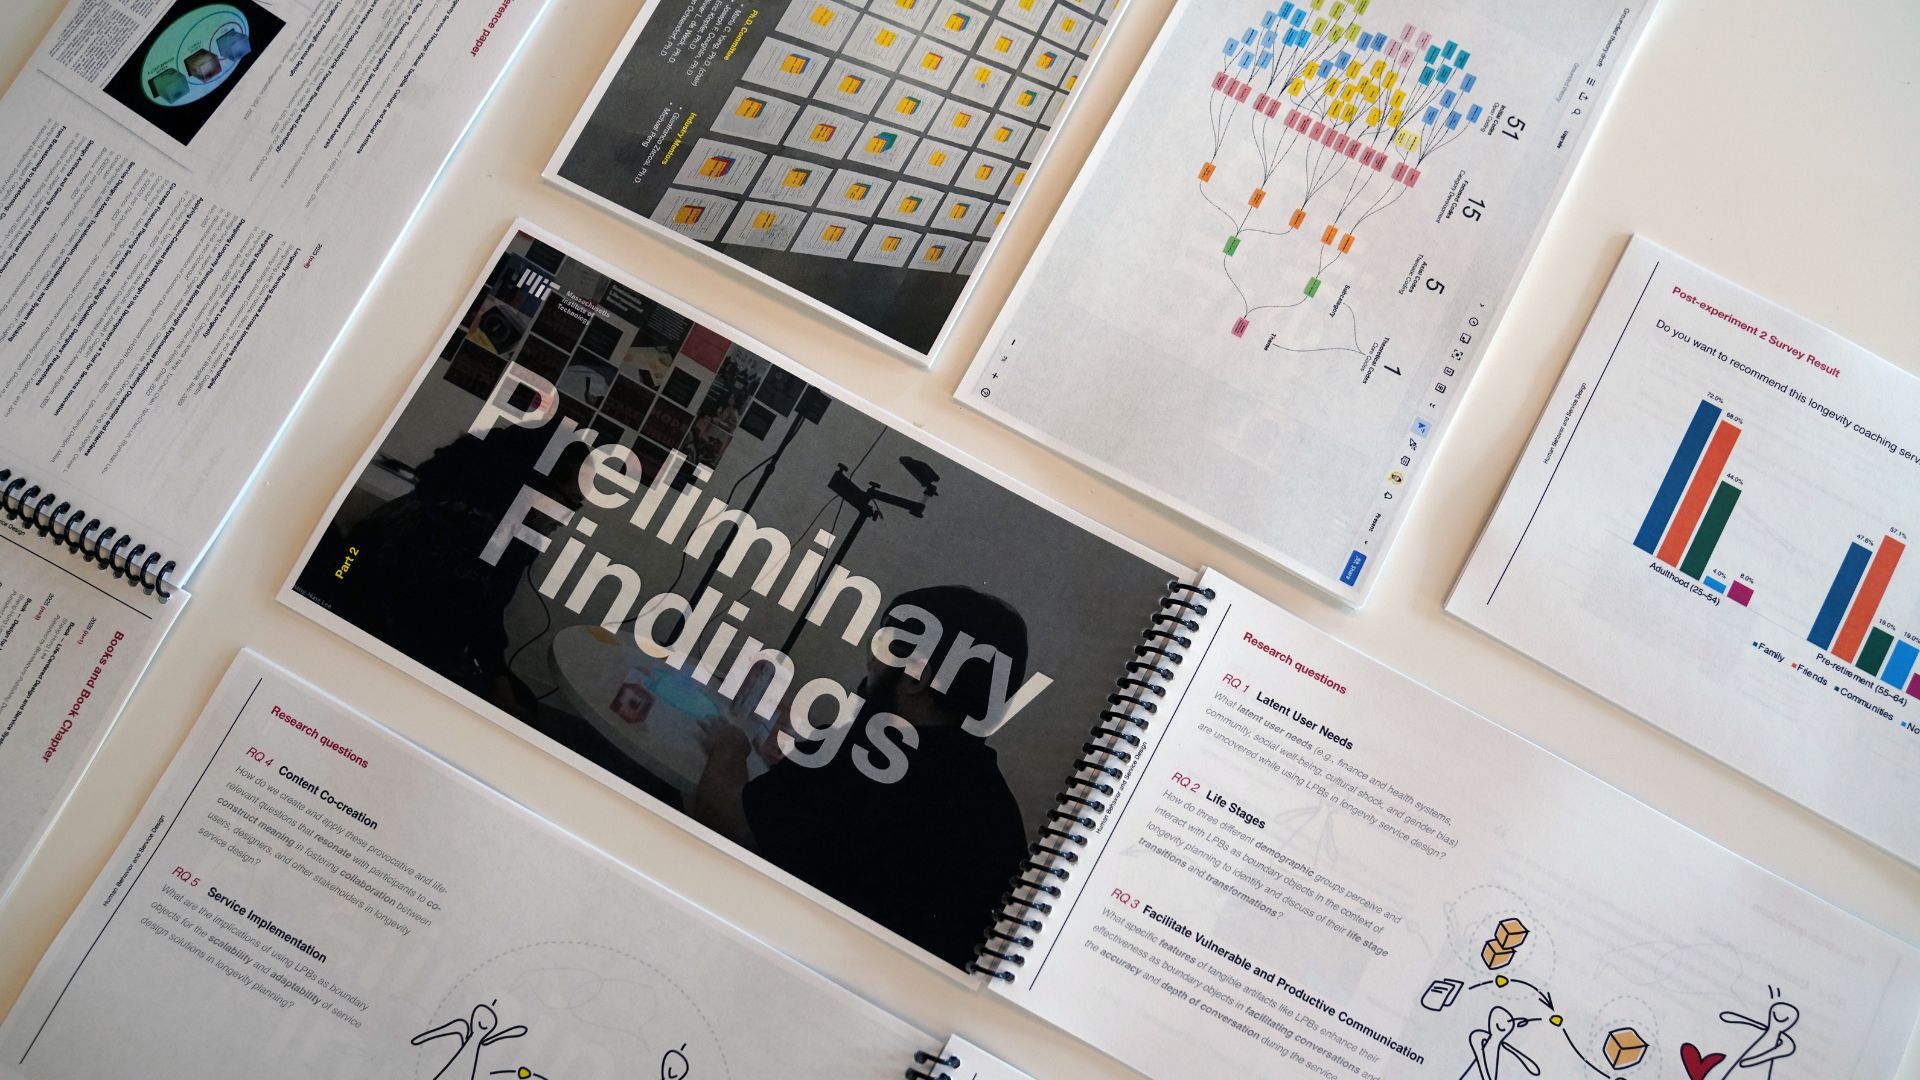
At the start of the fall semester at MIT, I successfully presented at my fourth PhD committee meeting. The weather in Cambridge was cozy, mirroring the atmosphere of the meeting. The discussion centered on my research on Design for Longevity (D4L), a descriptive study exploring the intersection of longevity planning, financial planning, and service design. I had an engaging exchange with my five advisors and mentors, each representing different disciplines: mechanical engineering, social science, aeronautics and astronautics, architecture and urban planning, and education.
One of the key topics we delved into was how data can strengthen the persuasiveness of storytelling, especially in descriptive research. This discussion sparked my interest in learning how to leverage three types of data: nominal data (categorical data like gender and occupation), ordinal data (data indicating order, like education level or income range), and scale data (numerical data measuring amounts or rankings, such as height or weight) to better articulate the qualitative research findings.
To effectively implement a data-driven approach, it’s important to consider why and how we apply it. For instance, adopting a “design in context” perspective allows us to account for the various factors that influence the desired outcomes before capturing and analyzing data (Bracher, 2024, page 250).
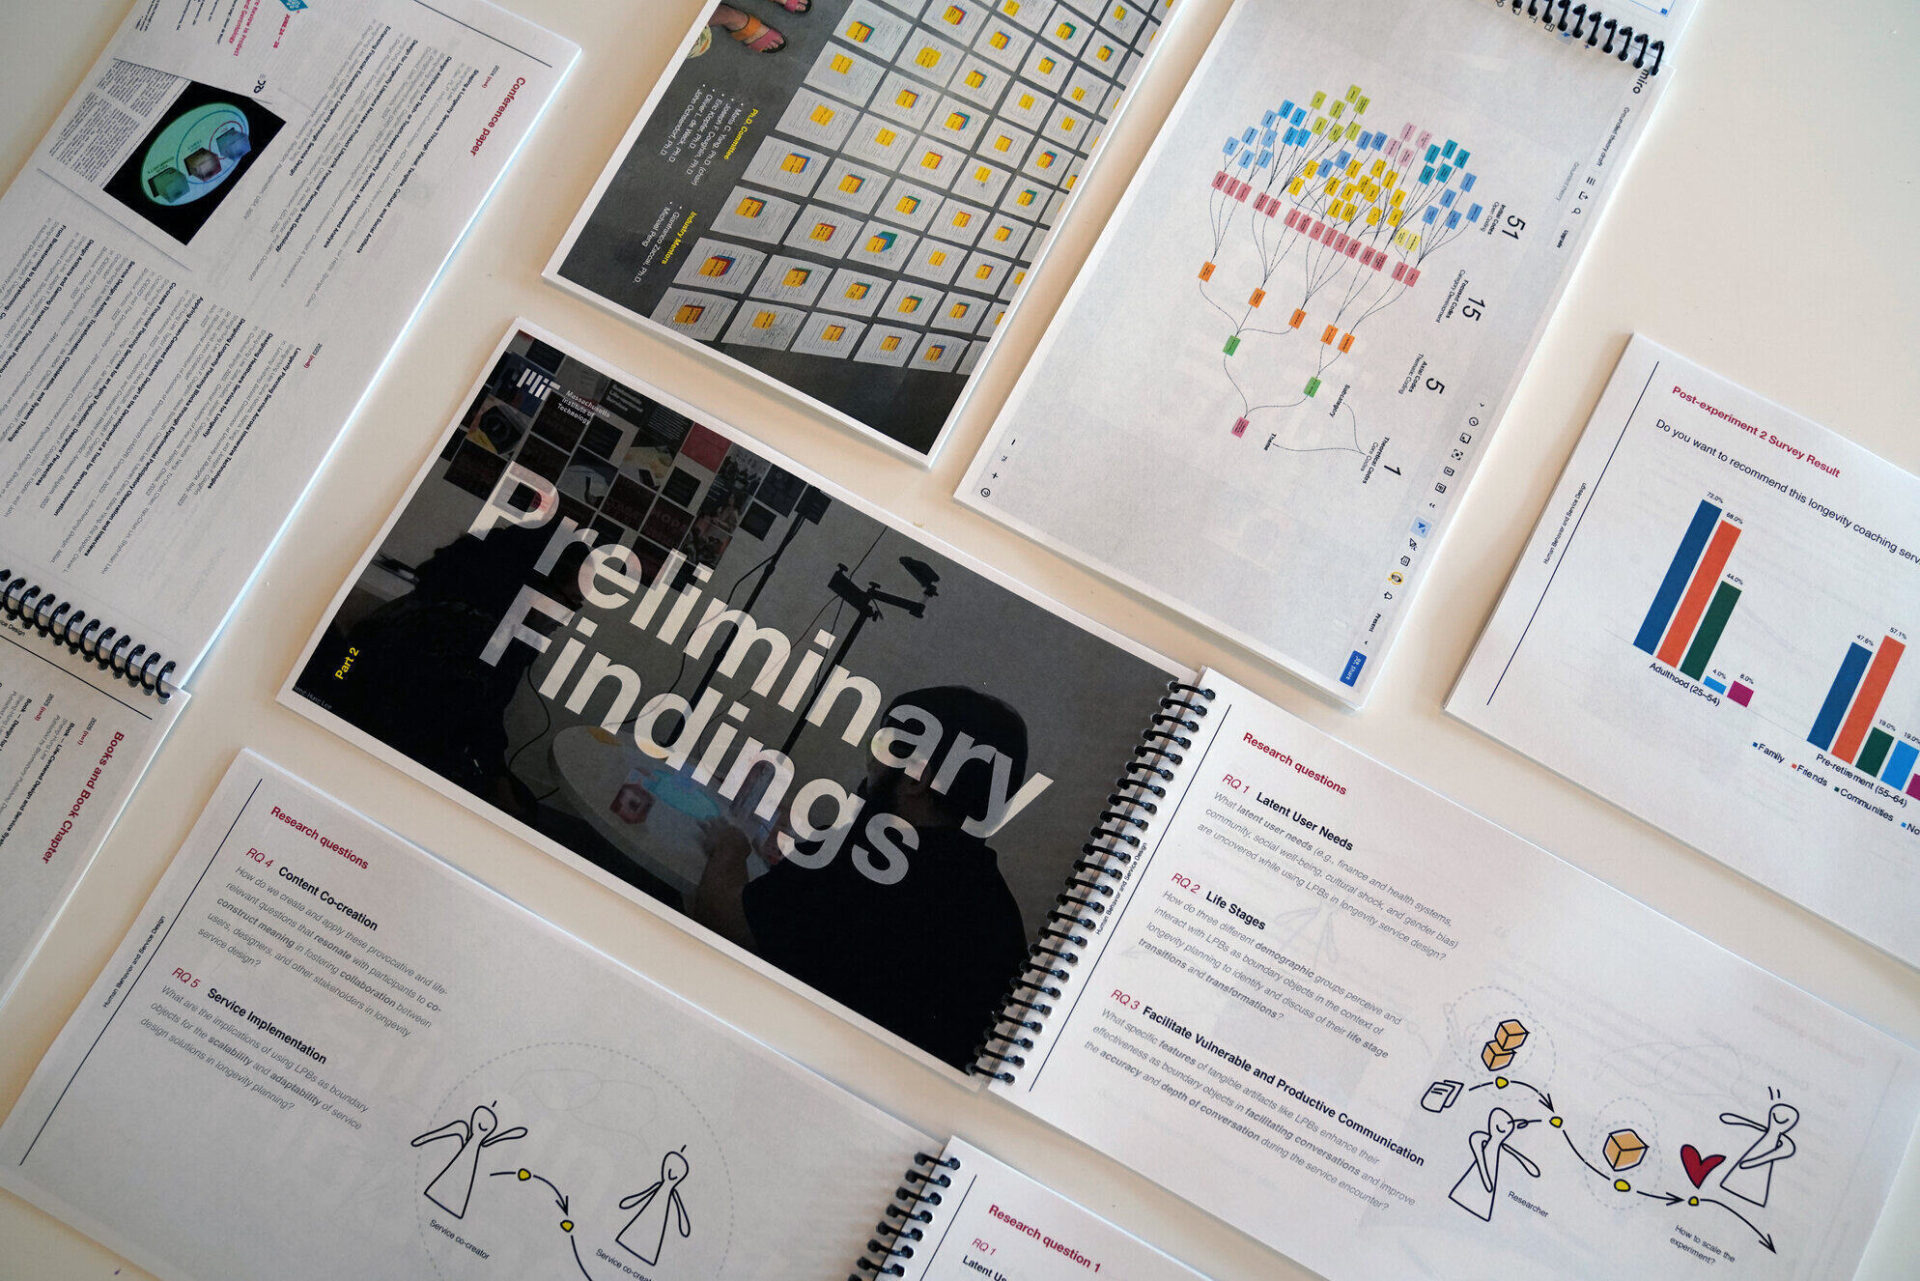
In the D4L project, my aim goes beyond merely presenting the interviews, quotes, survey results, and behavioral data I’ve collected from 69 qualified participants. I’m seeking to create a compelling narrative using a data- and evidence-driven approach to challenge established norms (Schweitzer et al., 2023, p. 43) and envision how we can intentionally leverage data and design to reflect, reveal, and address the desires of individuals within longevity planning systems (Figure 1).
When proposing the D4L concept, we aimed to explore and demonstrate strong correlations between variables such as gender, household income, investable assets, lifestyle, personality, and occupation. This approach allows us to identify key factors for future consideration at each tough point of the longevity planning service design process.
With this in mind, I would like to share three key insights inspired by the D4L concept, drawn from team discussions, preliminary literature reviews, and personal experience.
D4L’s key insights:
Re-construct a 3D object through its 2D shadows
We live in a world surrounded by data—everything from credit card bills and social media “likes” to daily commute times. As a product designer, I don’t consider myself a data expert, but my expertise lies in shaping 3D objects through form, color, material, finish (CMF), and user experience.
Metaphorically, data can be viewed as describing a person through their shadow, as a 2D representation of a 3D object shaped by perspective. The shadows vary with the sun’s position, distance, and angle, data interpretation shifts depending on context and viewpoint. From a top-down view, you can see a person’s hat, shirt, and bag, as well as the direction they intend to go (Figure 2).
Similarly, in statistics, factor analysis reduces dimensionality. When analyzing data, we are essentially searching for patterns or shadows. Although we may have less information, less noise, and fewer irrelevant variables in the dataset, this reduction can provide more space to derive meaningful insights.

As designers and researchers, how do we determine the optimal perspective, suitable colors, and appropriate shadow size to accurately reconstruct a 3D object (e.g., research questions, study objects)?
We can think of a research project as a method to help us uncover the “shadow” of the data, enabling us to effectively translate between 3D and 2D representations of information.
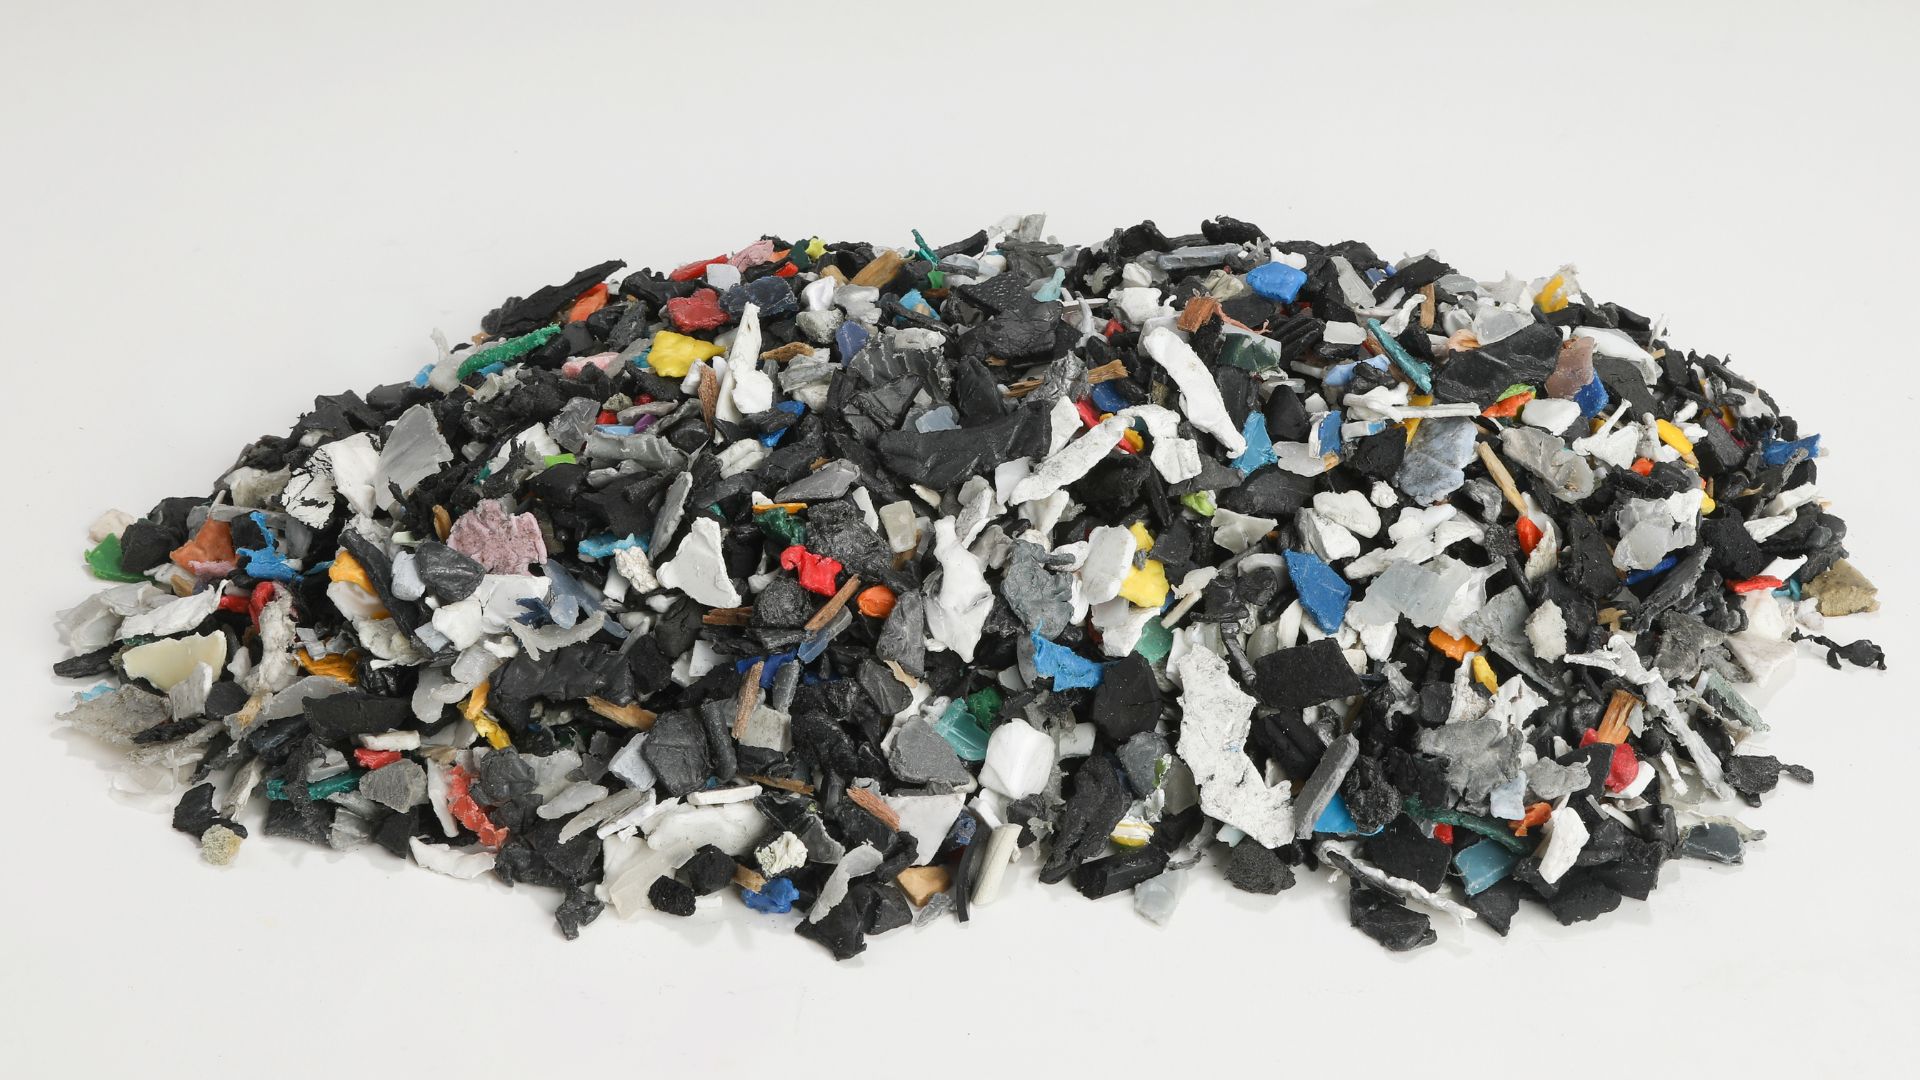
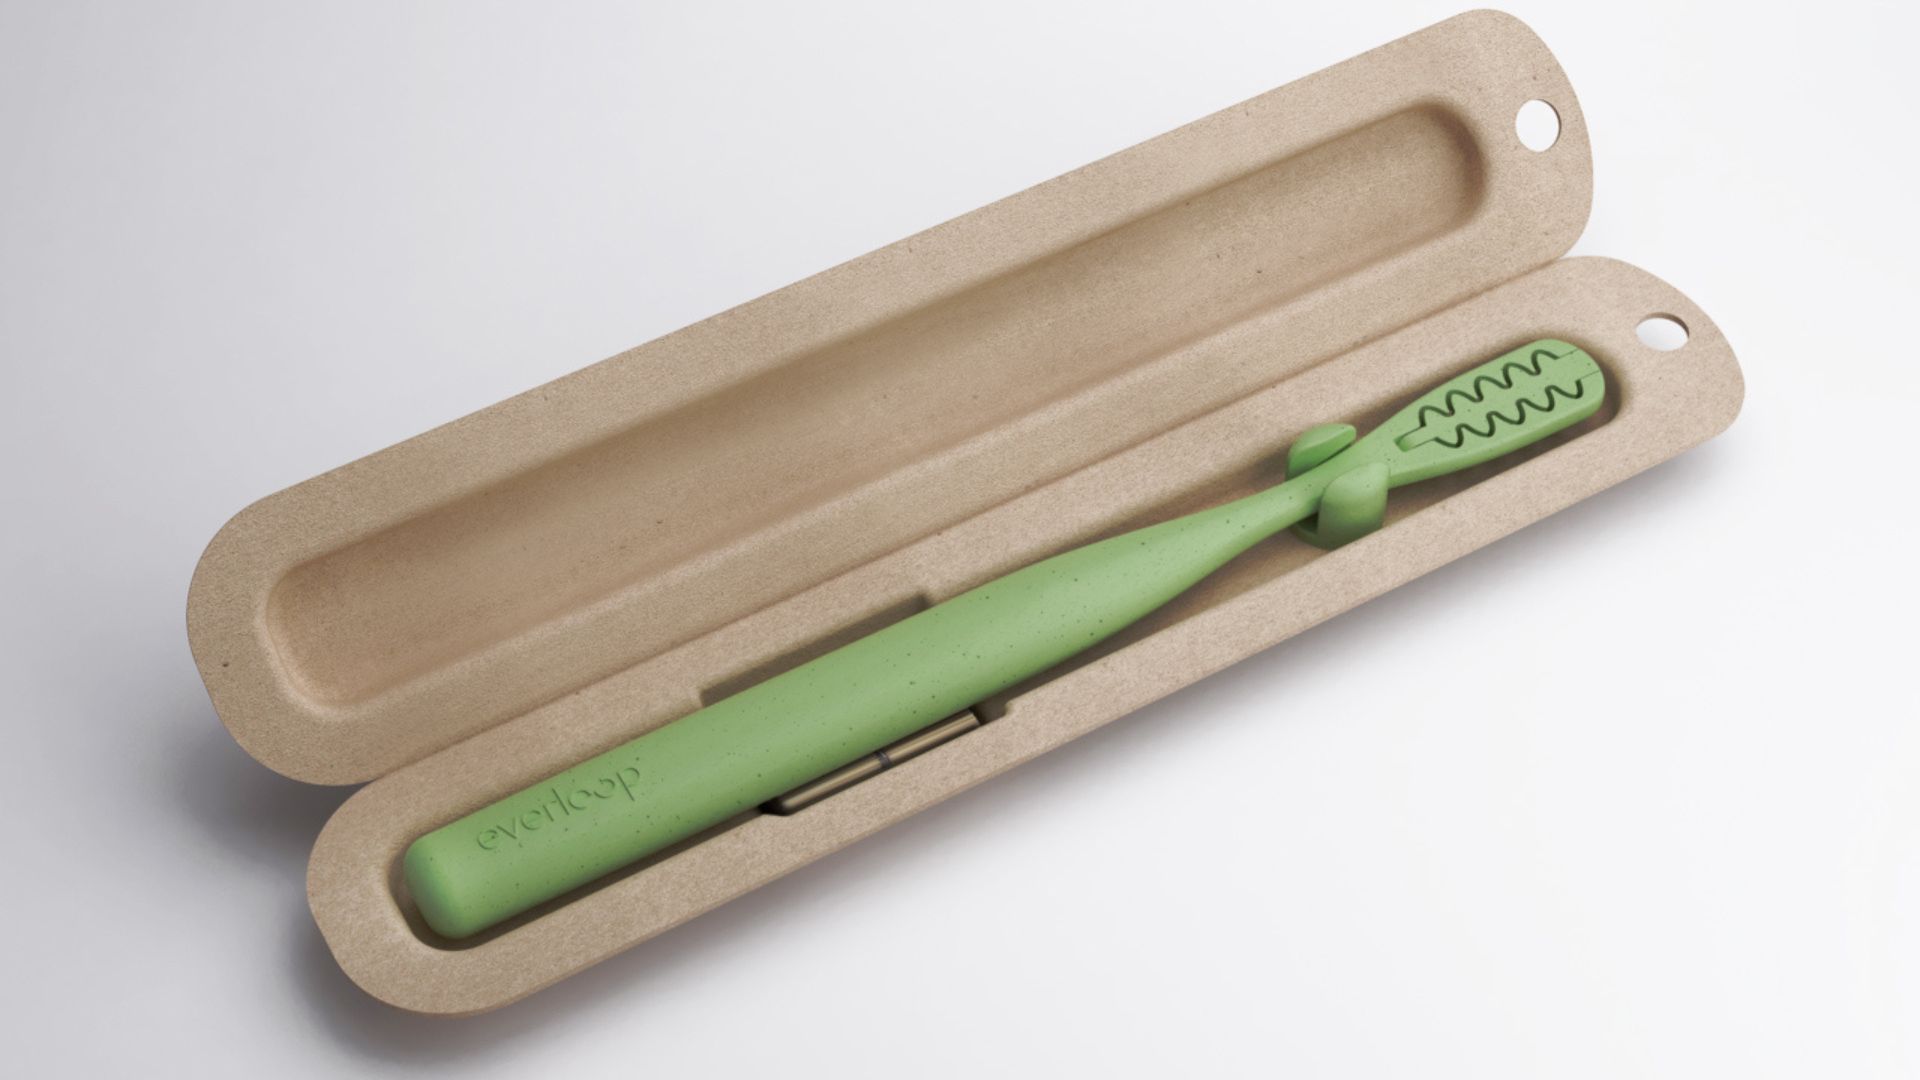
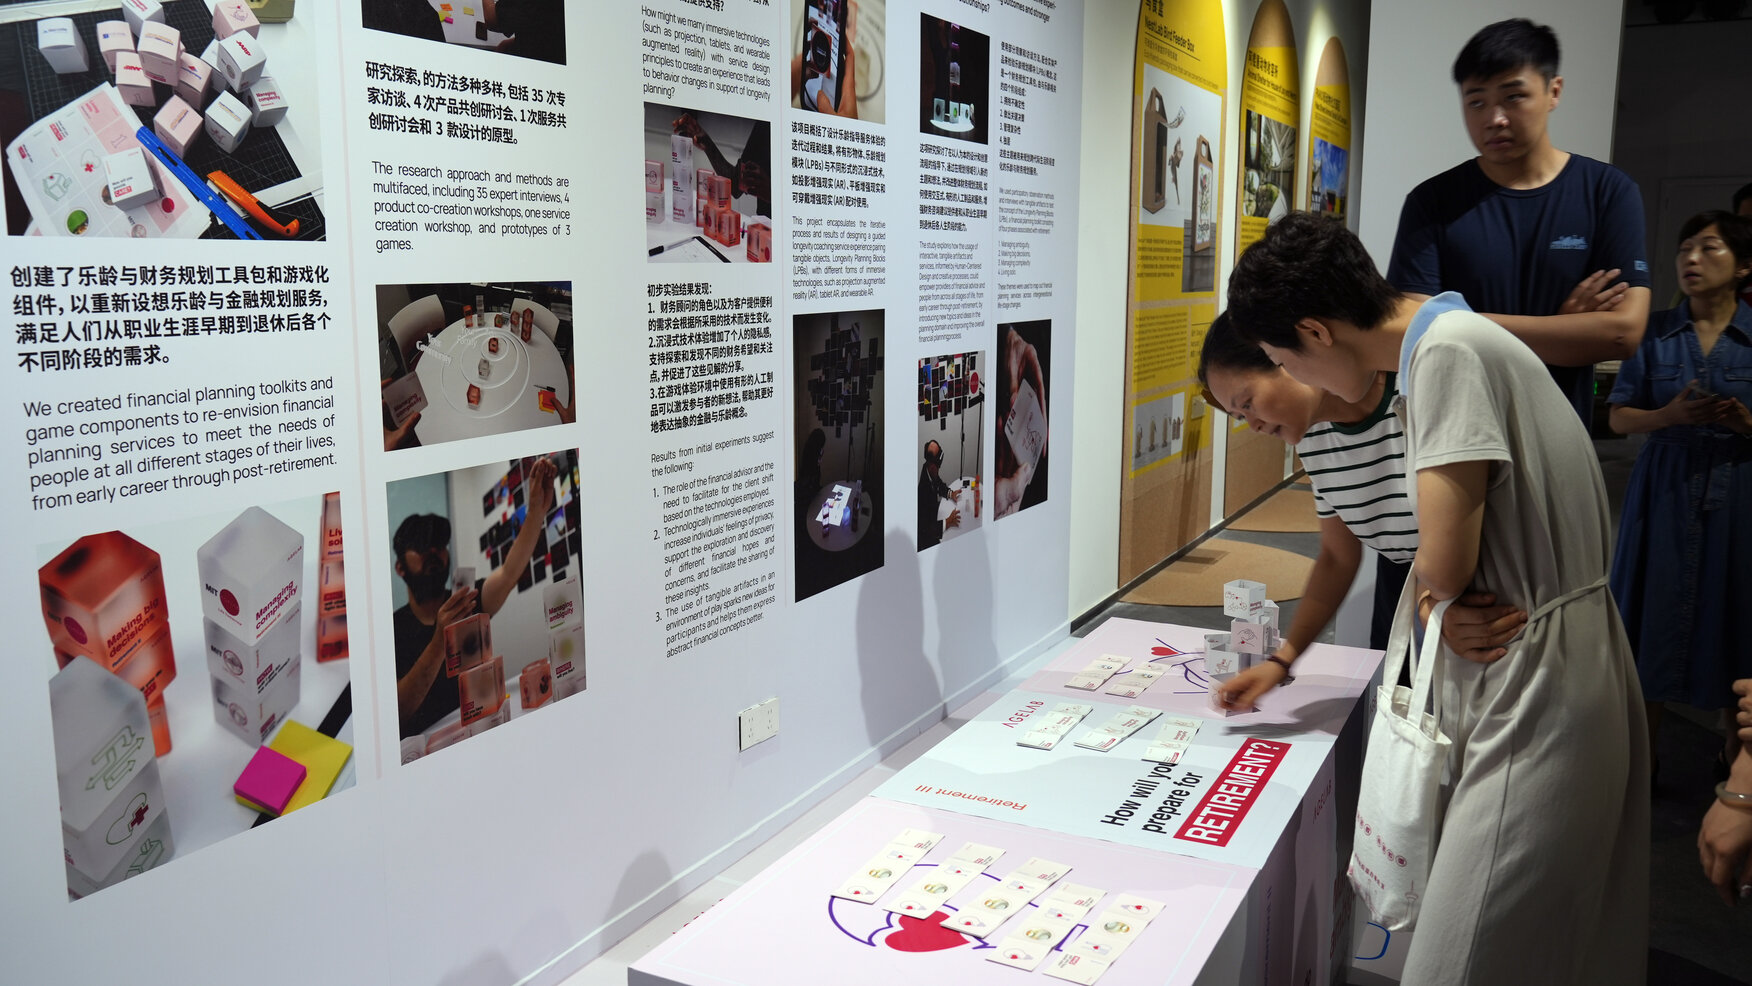
In the D4L project, we’re experimenting with innovative service models, using tangible artifacts—such as the 12 Longevity Planning Blocks (LPBs)—to help individuals understand the critical importance of longevity planning by drawing on expertise from financial planning.
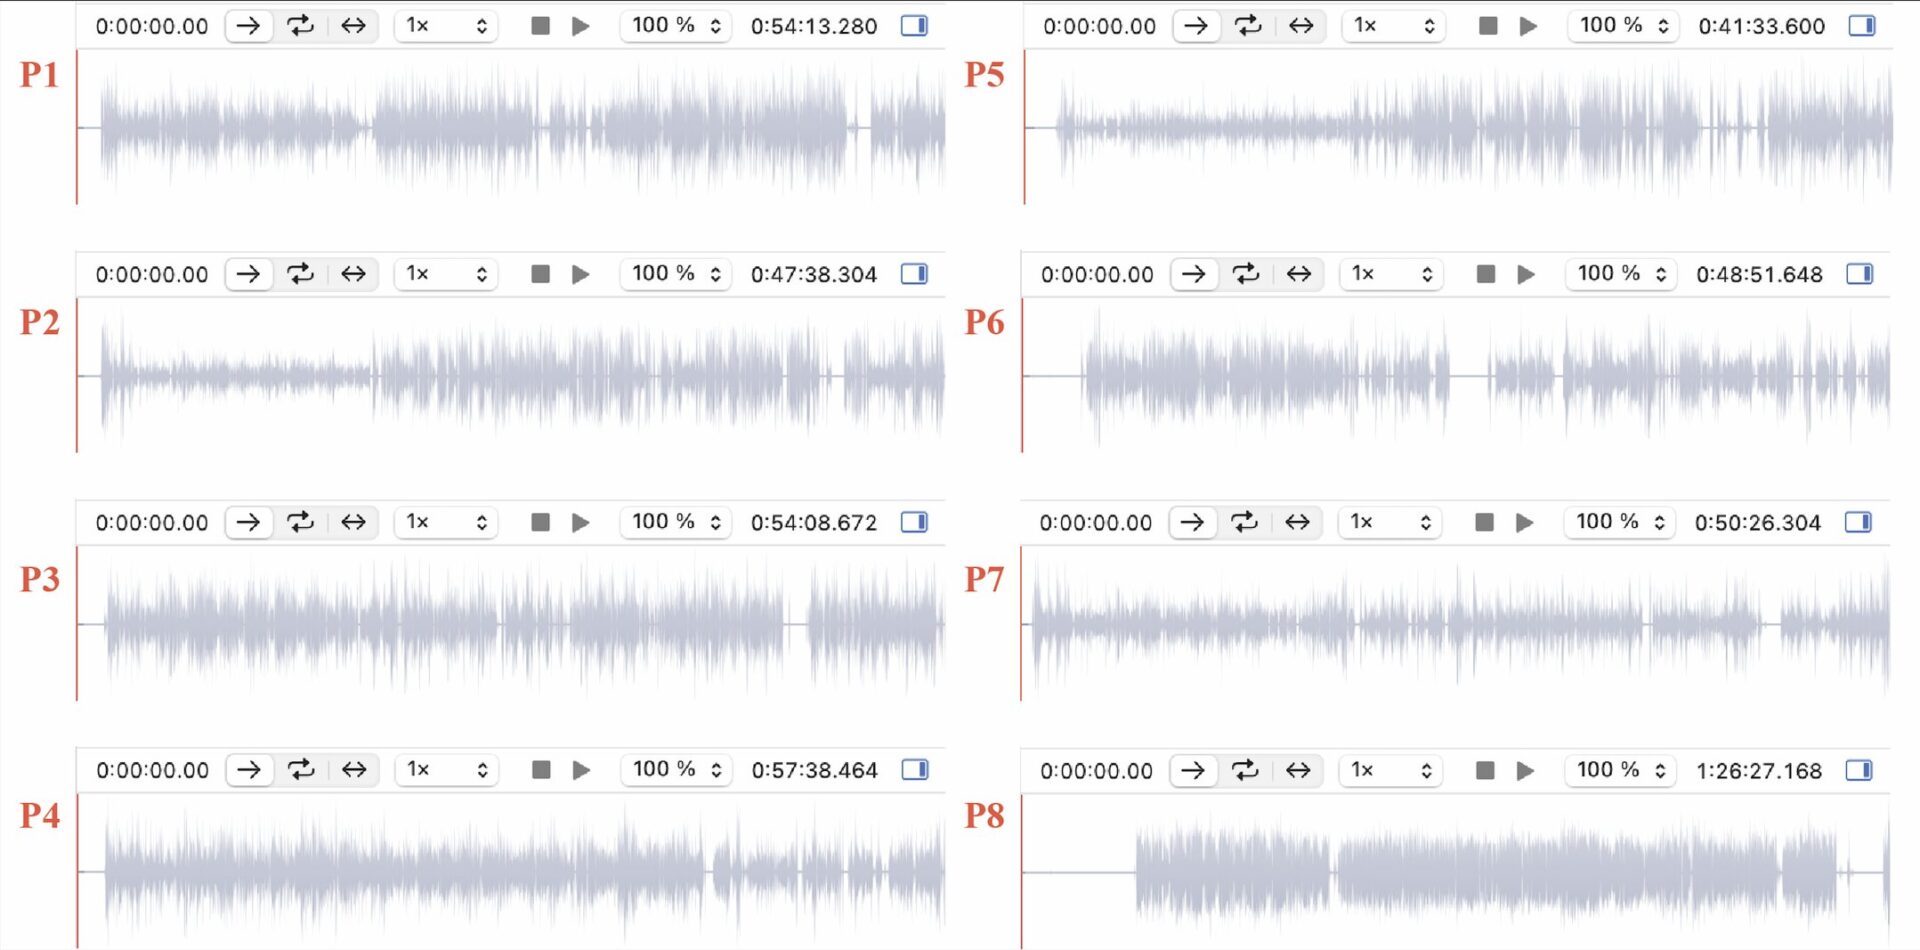
Beyond the pre- and post-experiment surveys that track participant perceptions and action shifts, we gather qualitative data from in-person experiments and interviews. For instance, we measure and analyze factors like the number of LPBs touched, questions asked, stories shared, and time spent engaging in the experiment.
We aim to uncover the key factors influencing people’s engagement with the D4L concept. Are gender differences shaping financial decision-making? Do cultural backgrounds—such as being an immigrant or part of a minority group—affect understanding of financial and longevity planning? Does income, education, or lifestyle play a role? Could age be a key factor, influencing engagement levels as reflected in the number of LPB touches, questions asked, and stories shared?
Shadows can be seen as representations of the variables mentioned above. The key challenge is to bridge the gap between the 3D world and 2D data, allowing us to craft a narrative that is both qualitative and quantitative to meet users’ needs, driven by stronger evidence and deeper insights (Figure 3).
Transform qualitative and quantitative data into meaningful narratives
What do we mean by “meaningful narratives”?
In academic research, compelling narratives can gain value by combining subjective insights—such as interviews, workshop outcomes, or qualitative observations—with objective evidence like data, standardized metrics, and quantitative findings.
Whether using qualitative or quantitative information, our goal is to shape narratives that add depth and context to our experiment. In the D4L project, for example, we explored the key research direction:
“How can we leverage subjective data (measurement) and personal stories to support the design of effective longevity planning services that address participants’ needs through tangible artifacts?”
With this critical research direction in mind, we collected discussion transcripts from participants (where their quotes serve as objective data), behavioral observations (allowing for subjective interpretations of actions such as movement or body language), and survey results (where ranking questions provide complementary insights).
These interesting narratives emerged from participants’ interactions with tangible artifacts (LPBs), supported by strategic and comprehensive data collection and synthesis.
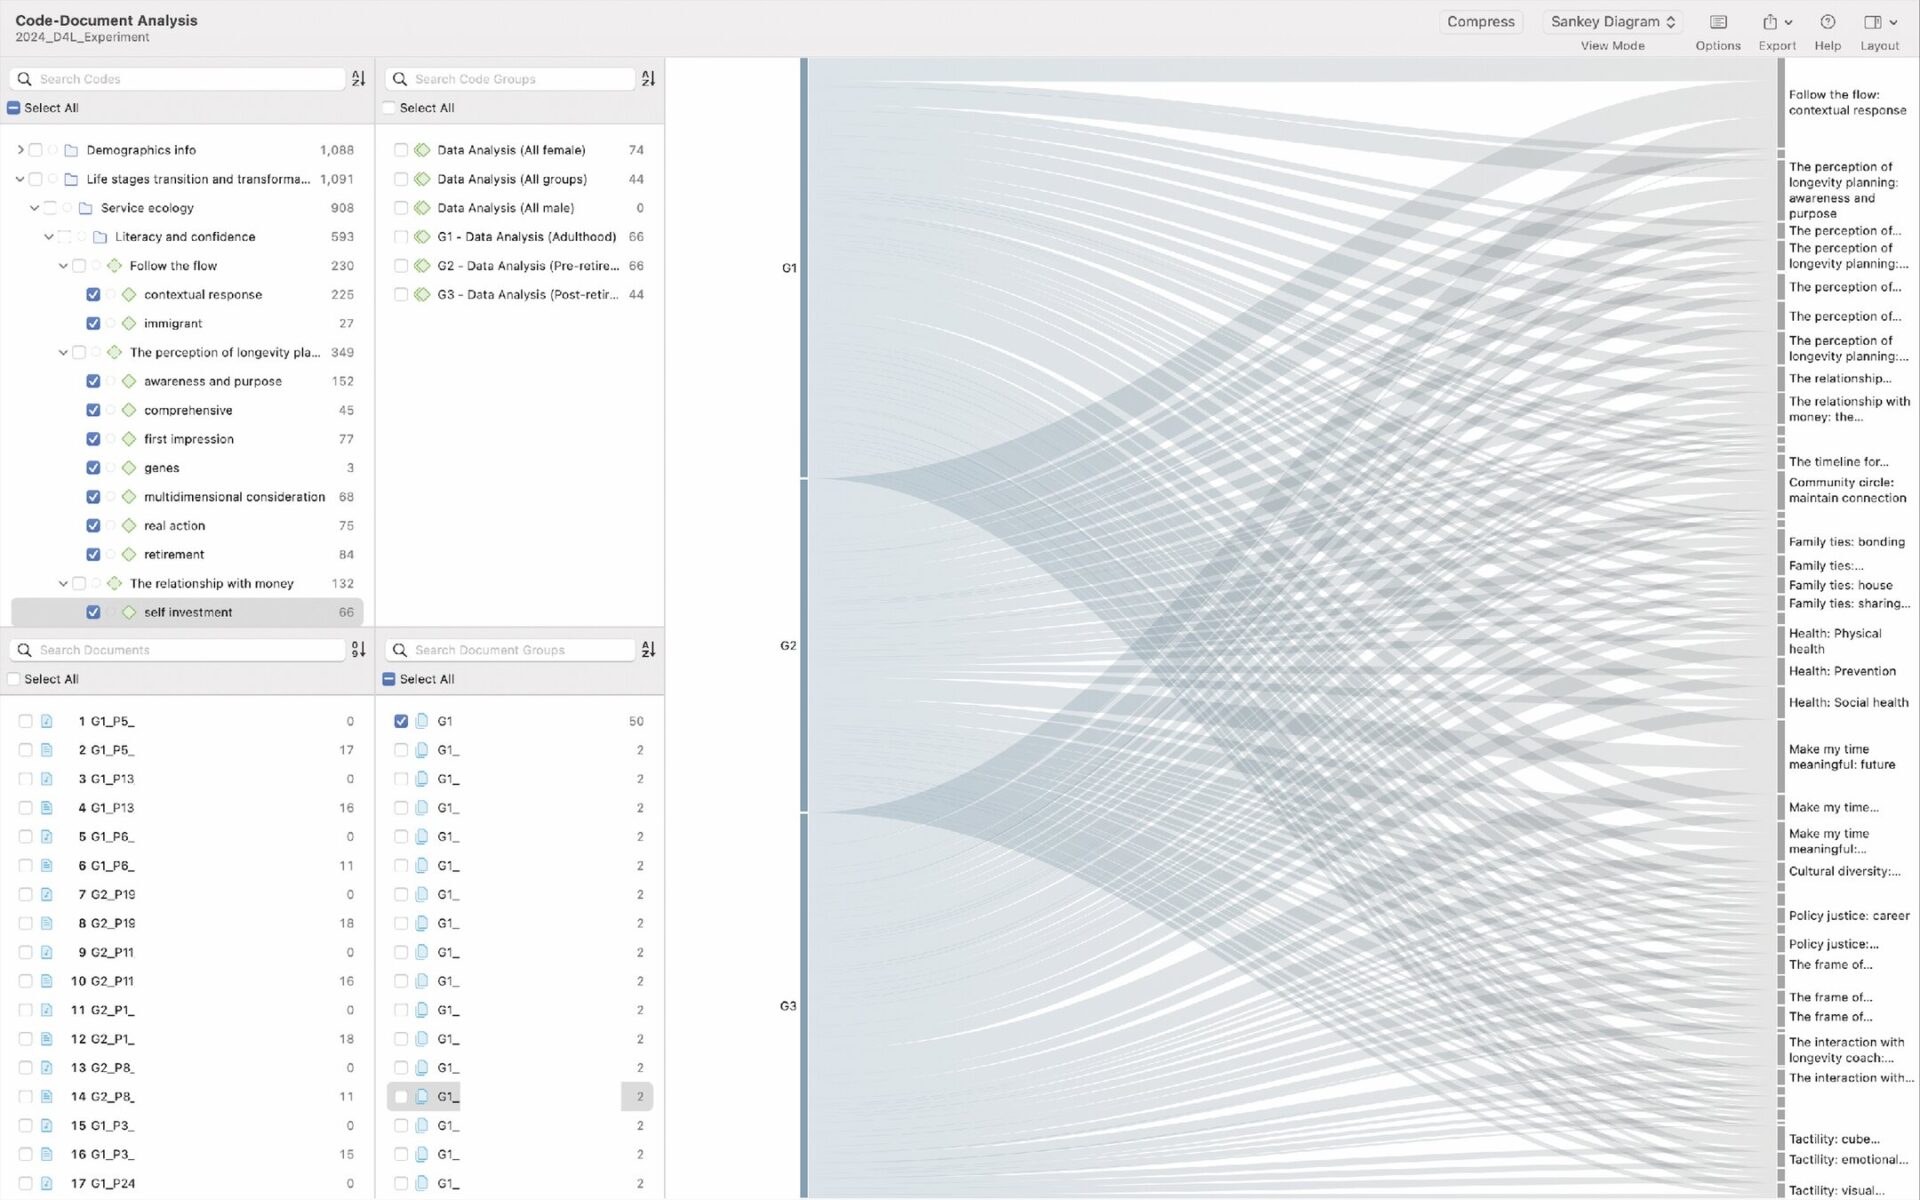
Figure 4 is presented as a Sankey diagram, serving as one of the data visualization prototypes. Although this study is primarily descriptive, we ensured a rich and comprehensive analysis by collecting diverse data types.
Move from merely capturing data to interpreting and making sense of it
“We don’t just capture data. We also need to make sense of it,” said Ji Ke, my former IDEO colleague and Chief Technology Officer at HAX. This brief comment, which took place during our fieldwork at IDEO, has stayed with me.
The information gathered from interviews—whether through cameras, phones, or Zoom—remains just that, information. However, true insight emerges from reflection, discussion, and understanding. Through these interactive and integrative processes, the information is digested, synthesized, and transformed into compelling storytelling.
The ability to make sense of data relies on strong empathy, keen observation, and comprehensive analysis. Data visualization can help us make sense of data.
Data visualization is an essential tool, as it enables people to more easily interpret patterns like central tendency, dispersion, and distribution. It also allows me to reflect on the underlying design intent behind the data.
Are there outliers we should investigate? Are there extreme or intriguing phenomena that deserve closer attention? Are there invalid data points skewing the overall results? Or perhaps the analytical model itself isn’t well suited for this type of descriptive analysis.
Data from the research can enhance stories, making them more meaningful by emphasizing the significance of design intention. For instance, in the D4L project, the initial strategy was to categorize the 69 participants by age into three groups: adulthood (25-54 years), pre-retirement (55-64 years), and post-retirement (65-74 years).
The three predefined age ranges can be used to categorize participants’ demographics. Additionally, we could explore alternative methods, such as hierarchical cluster analysis, to complement the data-driven approach for improved correlation results.
Thus, data analysis revealed an opportunity to refine these categories, recognizing that age alone does not fully capture the complexity of this research topic and the sophisticated needs of participants. The design intention focused on life stage transitions and transformation, going beyond simply counting years.
We gained deeper insights by using statistic value such as validating co-relation or regression to consider additional factors such as income level, education, occupation, High Potential Trait Indicator (HPTI) personality assessments, the number of LPBs touched, questions asked, and stories shared per person per experiment.
Creating with consciousness: how data and design meet desire?
I have utilized IBM SPSS Statistics, Qualtrics, and ATLAS.ti to explore the intersection of data and design. These analytical software have been invaluable for experimenting with data and forming my interpretations. There are, however, many other professional data analysis and visualizing tools that individuals may want to explore to find the one that best suits their needs.
In today’s landscape, where artificial intelligence (AI) is rapidly evolving, the demand for data-driven applications and insights has surged. Tools like ChatGPT allow us to update datasets in real time, providing analytical results and guidance as part of the design process.
Data has become a creative currency, pushing the boundaries of design and innovation. It enables us to:
- Reconstruct the new meanings of 3D objects from their 2D shadows (dataset)
- Transform both qualitative and quantitative data into compelling narratives
- Shift from merely capturing data to interpreting it in intentional ways
As someone new to the world of data, beyond designing academic research, I am eager to explore its business potential and social impact through a data-driven perspective. I am particularly interested in how we can leverage and integrate data insights to reshape the roles of designers and researchers, enabling them to envision broader business strategies and address complex societal challenges (Figure 5).
This approach empowers us to ask bigger questions, reframe problems, and tackle intricate socio-economic and technological issues. Our environment continuously evolves—growing, transforming, adapting, and regenerating in response to human desires (Papanek, 1971, p. 294). Ultimately, the goal is to elevate both design and quality of life by merging creativity with consciousness, using data to meet the desire of the ecosystem.
Reference:
About the author

Sheng-Hung Lee is an Assistant Professor of Urban Technology at the University of Michigan and Director of the d-mix lab. Trained in both design and engineering, his work explores how technology and human-centered design can shape more equitable and longevity-ready societies.
WebsiteInstagramLinkedin